
ESG Reporting
Sustainability Data Is No Longer Separate from the Sustainability Report
For many years a sustainability report could be built in a sensible and predictable order. The team began early in the year. It drafted the narrative, described the programmes and initiatives that had run, prepared the policy and governance sections and sent a data template out to the business. Management reviewed the draft while the template made its way back.
Once the year-end figures arrived, they went into the performance tables and charts. The report had a final review and went to design.
The order worked because of what the report contained. Much of it described what the company had done; the data recorded how it had performed. The two met at the end. A late figure changed a table rather than the argument around it.
For many years, sustainability data could be treated as something that completed the report. Increasingly, it is something that helps determine the report.
Why the model is becoming harder to maintain
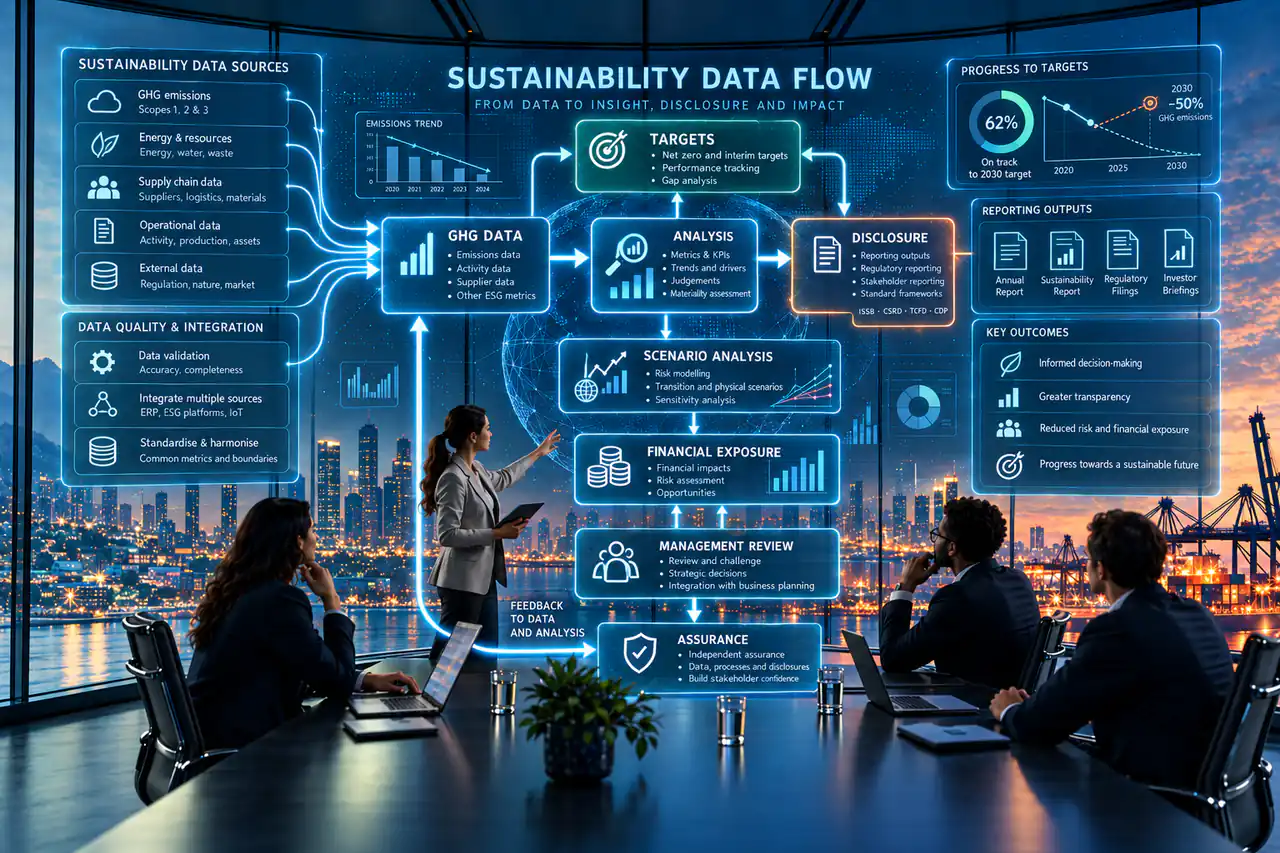
The usual explanation is that there is more data. There is, although volume is not the main change. The more important shift is that the data now sits upstream of other work. A year-end figure can feed calculations, targets, scenario analysis, the assessment of climate-related risks and opportunities, estimates of financial effect, the narrative that explains them and the evidence a reviewer or assurance provider will ask to see.
When one figure is an input to that much, receiving it late is no longer a matter of updating a table. It can create work further down the chain.
The reporting standards reflect this. IFRS S1 asks companies to explain the connections between their sustainability-related risks and opportunities, between the disclosures themselves and between those disclosures and the financial statements. IFRS S2 adds climate-related metrics, targets and an assessment of climate resilience. In Malaysia, the National Sustainability Reporting Framework phases both standards in for listed issuers, beginning with the largest Main Market companies for financial years starting in 2025, with a climate-first relief for their first two years. The result is a report whose parts depend on one another.
When data becomes an analytical input
Take electricity. It is one of the most familiar numbers in a sustainability report, usually collected from utility bills or meters across a company’s sites.
Once collected, it becomes Scope 2 emissions: under the GHG Protocol’s Scope 2 Guidance, on a location basis and also on a market basis where the company operates in markets with contractual instruments such as renewable energy certificates. Scope 2 then flows into total emissions and the year-on-year comparison. The same figure sets the renewable-energy percentage. Where the company has an energy or emissions target, it determines progress against that target.
It may also be one of the inputs to climate scenario analysis, through which it can reach the assessment of climate-related risks and the estimate of their potential financial effect. It then reappears in the narrative that explains each of these. A meter reading is therefore not one number in one table. It is an input to several analyses, some of which feed others.
One Dataset, Many Disclosures
Electricity Data Does Not Stop at the Table
Electricity data
Utility bills and meter readings from every site.
Scope 2 emissions
Location-based and market-based figures; through them, the total GHG inventory.
Renewable-energy share
The proportion of electricity drawn from renewable sources.
Performance against target
Year-on-year movement and progress towards energy or emissions targets.
Climate analysis
Scenario inputs, transition exposure and the resilience assessment.
Financial implications
Potential effects on costs, assets and planning.
Final disclosures
Metrics, targets, narrative and climate-related disclosures.
The figure is collected once and used many times. If it changes, the work built on it may need to be revisited.
Illustrative. Which analyses an electricity figure reaches depends on the company, its targets and its approach to scenario analysis.
Scenario analysis changes the timetable
Scenario analysis is where the dependency is clearest. Assessing how a business might fare under different climate pathways usually starts from its current position: its emissions and energy use, the activities behind them and the assets and revenues exposed to physical or transition risk.
A typical sequence runs from electricity, fuel and other activity data to the GHG inventory; from the inventory to the scenario assumptions applied to it; from those assumptions to the physical and transition exposure they imply; then to the potential financial effects and finally to the disclosure. A carbon price applied to an inventory gives a different cost when the inventory changes.
The inputs differ from company to company. IFRS S2 expects the approach to scenario analysis to be commensurate with a company’s circumstances, using the reasonable and supportable information available at the reporting date without undue cost or effort. It also allows the analysis itself to be updated in line with the strategic planning cycle, while the resilience assessment is reported every period. What does not vary is the structure: the analysis is built on earlier work.
If the data is still changing, the analysis built on that data may still be changing too.
Scenario analysis started before the inventory settles may need to be rerun or reconciled when the final figures arrive. Scenario analysis that waits for the inventory moves to the end of the cycle, at the point where review time is shortest.
The Dependency Chain
Each Stage Waits for the One Before
01
Source data
For example
Electricity, fuel and activity data
02
Calculation
For example
GHG inventory
03
Analysis
For example
Scenario analysis and financial exposure
04
Management review
For example
Challenge and approval of the results
05
Disclosure
For example
IFRS S1 and S2 disclosures
A stage can begin before the one before it is final, but it cannot finish first. Work started on provisional figures has to be checked against the final ones.
Illustrative. The inputs to scenario analysis differ between companies; the dependency on earlier stages does not.
Targets create another feedback loop
Year-end data also answers a question the report has to address: was the target met? Actual emissions are compared with the baseline and the planned trajectory. If performance is on track, the report says so. If it is not, further questions follow: why, what management intends to do about it and whether the initiatives behind the target need to change.
IFRS S2 asks for performance against each climate-related target, an analysis of trends or changes in that performance and an explanation of any revision to a target. Where the baseline itself is recalculated, a subject covered in our article on restating GHG emissions, the comparison moves again.
The final data therefore shapes what the company says about the year just ended and also what it says about the next one. The report holds two kinds of content that rest on the same numbers: historical performance and forward-looking decisions informed by that performance. A shortfall does not oblige a company to change its target. It does call for a view on what the shortfall means. That view takes time to form.
Not every part of the report has the same dependency
None of this means the whole report has to wait for year-end data. Much of it does not depend on that data at all. It can be drafted, reviewed and largely settled early. Other sections increasingly depend on final or sufficiently mature data, as does the materiality assessment where current information changes the picture.
Can often be prepared early
- Community programmes
- Employee initiatives
- Policies
- Governance descriptions
- Completed programmes
- Many case studies
Depends on mature data
- GHG performance
- Target progress
- Climate-related metrics
- Scenario analysis
- Financial effects
- Many IFRS S1 and S2 disclosures
The distinction matters more than the start date. Early drafting still works well for the first group. The second group behaves differently.
The parts with analytical dependencies cannot be treated as though data is merely an appendix added at the end.
Financial information enters the process
Sustainability information increasingly meets financial information. Revenue, operating costs, capital expenditure, asset values, impairment assumptions, financing and provisions can all be relevant when a company assesses the potential financial effect of a climate-related risk.
The relationship runs in both directions. A sustainability analysis may draw on financial information, such as the revenue tied to a carbon-intensive product line or the carrying value of assets in an area exposed to flooding. Financial information may in turn reflect matters that the sustainability analysis has brought into view, where the accounting standards already call for it. IFRS S1 asks that the data and assumptions used in sustainability-related financial disclosures be consistent with those used in the financial statements, to the extent possible.
Sustainability analysis does not automatically change the financial statements. The point is that the two draw on connected information. If an impairment assumption or a capital expenditure plan changes late in the financial close, the analysis that relied on it may need to be revisited. Our article on connecting sustainability risks to financial effects looks at that link in more detail; it is also the work behind financial exposure quantification.
Assurance creates another feedback loop
Review and assurance are often pictured as the last step: the report is finished and someone checks it. In practice the process can run differently.
Engagements vary in scope, level and approach, from limited assurance over Scope 1 and Scope 2 emissions to a broader review of selected indicators. Bursa Malaysia’s Main Market Listing Requirements already ask issuers to state whether their sustainability statement has been reviewed by internal audit or independently assured. The IAASB’s ISSA 5000 now provides an international standard for sustainability assurance engagements. Whatever the scope, the process tends to raise questions about source data, calculations, boundaries, assumptions, methodologies, supporting evidence, reconciliations and changes from the prior period.
Answering them can take the team back through the chain: to the source information, through the calculation and analysis, to the disclosure. A corrected boundary changes the inventory; a changed inventory may change target progress and the inputs to scenario analysis. Assurance is therefore not necessarily a final administrative step. It can feed back into the analysis it reviews.
The Assurance Feedback Loop
Assurance Feeds Back into the Analysis
Source data
Meter readings, invoices, activity records.
Calculation
Emission factors, boundaries, methods.
Analysis
Targets, scenarios, financial effects.
Disclosure
Metrics, narrative and supporting notes.
Review or assurance
Testing of data, methods and evidence.
Questions and amendments
Corrections, reconciliations, further evidence.
Back to source data
A question in review can reopen the start of the chain. A corrected boundary or emission factor changes the calculation and may change everything built on it.
Illustrative. The scope, level and approach of review and assurance differ between engagements.
Why last-minute data is becoming more difficult
In the past, receiving sustainability data late was inconvenient. Increasingly, it can be structurally disruptive.
Suppose the electricity figure for one site arrives three weeks after the rest or a corrected meter reading changes the total. The team may need to revisit Scope 2 emissions, total GHG emissions, renewable-energy percentages, year-on-year performance, target progress, the scenario analysis, the financial implications, the charts, the narrative, the supporting calculations and the evidence prepared for assurance.
Not every item will move. A small correction may change nothing beyond the inventory. The difficulty is that nobody knows which items have moved until each one has been checked. The checking falls at the point in the cycle when time is shortest.
Reporting timelines therefore need to move forward
The obvious response would be to finish the report earlier. On its own that rarely helps: the dependent sections still wait for the same data.
The more useful change is to identify the dependencies earlier and to start the underlying data and analysis earlier. In practice that tends to mean planning which data the report will need before the year ends, agreeing who owns each dataset and collecting key activity data progressively rather than all at once. Validating figures as they arrive brings gaps in evidence to light while there is still time to close them. Preliminary calculations on nine or ten months of data show where the inventory is heading. Scenario analysis can be staged, with its structure and assumptions settled early and the final figures applied once they mature.
Management review then becomes progressive rather than a single event at the end. Drafting becomes iterative, with a final reconciliation before publication to confirm that every figure, chart and sentence draws on the same data.
The calendar adds its own pressure. IFRS S1 expects sustainability-related financial disclosures to be reported at the same time as the related financial statements, with relief in the first year of application. In Malaysia, the sustainability statement already forms part of the annual report; Bursa Malaysia’s transition reliefs concern scope rather than timing. As the sustainability analysis draws more heavily on financial information, the two processes converge on the same timetable.
Two Reporting Cycles
From a Reporting Timetable to a Reporting System
A linear timetable
- Narrative
- Management review
- Year-end data
- Tables and charts
- Final review
- Publication
Each step hands over to the next. Data arrives once, near the end, to complete the report.
An interconnected system
Information that matures through the year
- GHG data
- Targets
- Scenario analysis
- Financial information
- Materiality
Analysis
Inputs combined into metrics, assessments and effects.
Draft disclosure
Narrative written alongside the analysis.
Management review
Challenge, judgement and decisions.
Review or assurance
Questions on data, methods and evidence.
Amendments
Corrections and reconciliations.
Revised data and assumptions
Late figures and changed assumptions flow back in.
Back to analysis
The report leaves the cycle when the figures, the analysis and the narrative agree. Until then, a change anywhere in the loop can travel round it.
Illustrative. Narrative that does not depend on the data, such as policies and completed programmes, can still follow the linear path.
The report is becoming an output, not the process itself
Taken together, these dependencies change what the sustainability report is. It increasingly represents the output of data collection, calculation, analysis, management decisions, financial assessment, target setting, scenario analysis, review and assurance. The document is the visible part of an interconnected information process.
The sustainability report is increasingly the output of the process, not the process itself.
That is also why the quality of a report depends more and more on work done away from it. A well-written section can only be as settled as the analysis beneath it. For GHG data in particular, the method decisions examined in our GHG emissions series are made long before anyone drafts a sentence about them: how spend-based Scope 3 emissions are calculated, how double counting is kept out of the inventory, when a custom emission factor is more accurate than an average and whether a trade-adjusted factor better represents an imported good.
When the information should be ready
The more sustainability data becomes connected to analysis, financial information, targets and decision-making, the less realistic it becomes to treat the report as a document assembled at the end of the reporting cycle.
Some sections can still be prepared early. The data-dependent parts of the report, however, increasingly need to be developed alongside the underlying analysis rather than waiting for a final data drop.
The question is no longer simply when the report should be written. It is when the information needed to support the report should be ready.
References
- IFRS Foundation, IFRS S1 General Requirements for Disclosure of Sustainability-related Financial Information, 2023, on connected information, consistency of data and assumptions with the financial statements, timing of reporting and the transition reliefs.
- IFRS Foundation, IFRS S2 Climate-related Disclosures, 2023, on climate resilience and scenario analysis, cross-industry metrics including Scope 1, 2 and 3 emissions and performance against climate-related targets.
- GHG Protocol, Scope 2 Guidance, 2015, on location-based and market-based reporting of purchased electricity.
- Securities Commission Malaysia, Advisory Committee on Sustainability Reporting, National Sustainability Reporting Framework, 2024, on the phased application of IFRS S1 and S2 in Malaysia.
- Bursa Malaysia, ‘Bursa Malaysia Requires Sustainability Reporting Using the IFRS Sustainability Disclosure Standards’, media release, 23 December 2024, and Main Market Listing Requirements, Practice Note 9, on the sustainability statement in the annual report, the climate-first transition reliefs and the statement of internal review or independent assurance.
- IAASB, International Standard on Sustainability Assurance (ISSA) 5000, General Requirements for Sustainability Assurance Engagements, 2024.
Ace CSR supports Malaysian companies with sustainability reporting, IFRS S1 and S2 advisory, GHG accounting and climate scenario analysis, including planning the reporting cycle around the data each disclosure depends on.
Explore More
Planning your next reporting cycle around its dependencies?